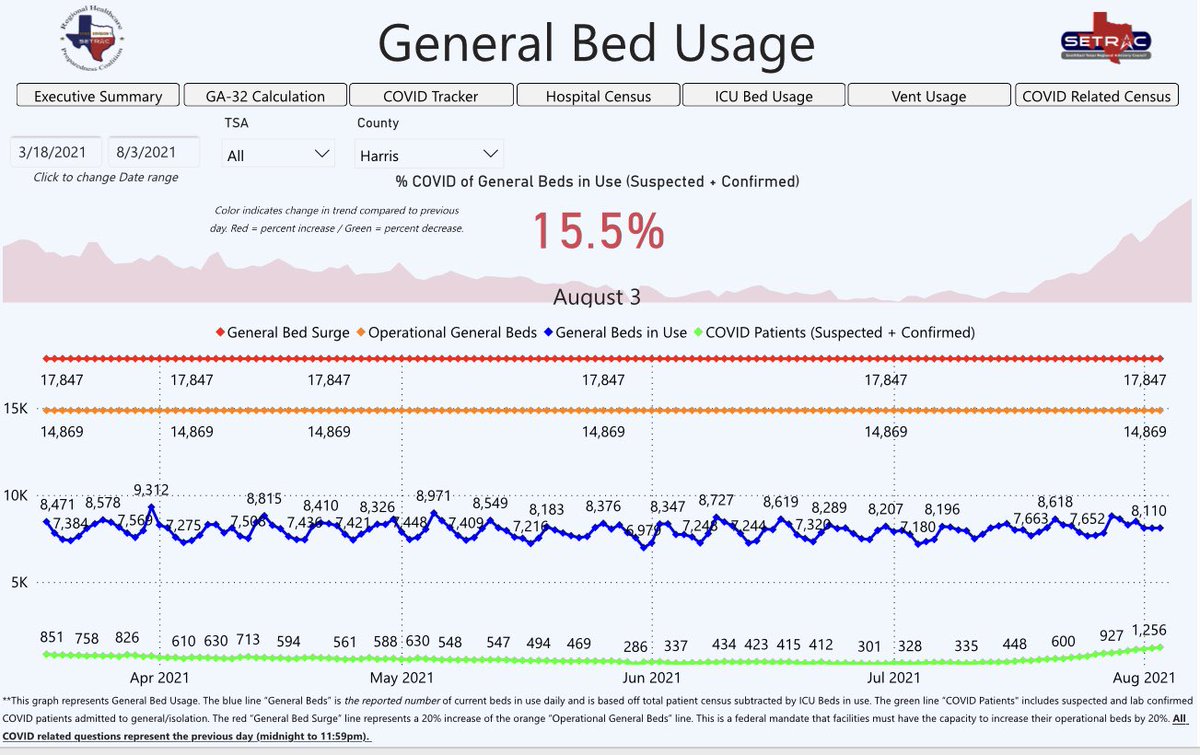
My county commissioner shared these two charts. Clearly our hospital capacity is FINE, but the trend is a bit alarming. More than a bit.

Then I decided to create those same charts for a full year, to see if there is a cyclical nature to this.
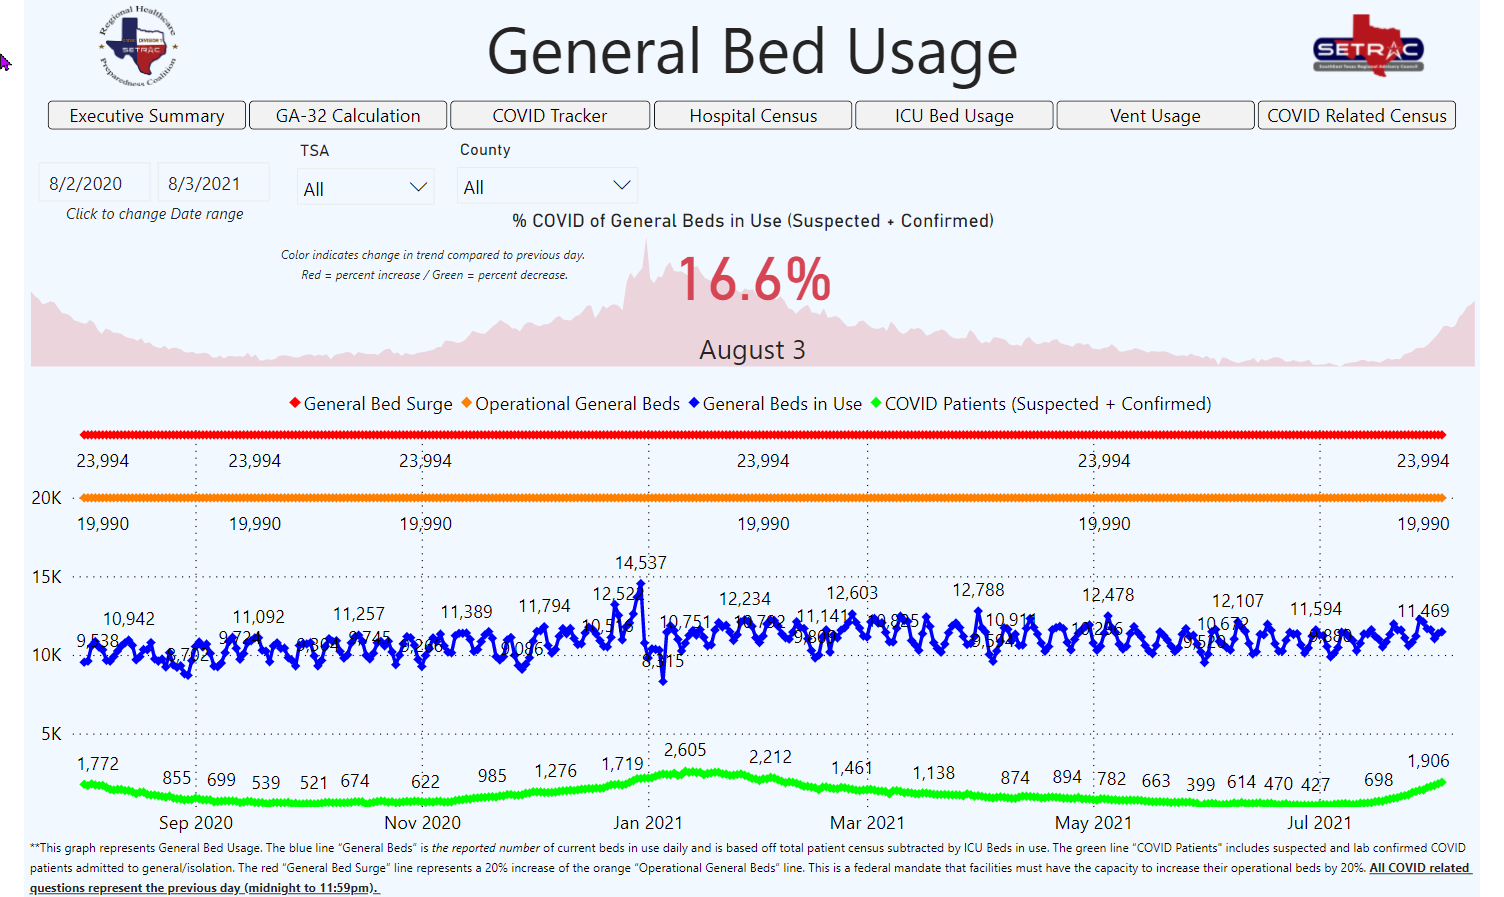

Yes, of course there is. Nature is what it is, and even operates on engineered viruses. So…there is a trend, it deserves watching, it does not deserve panic.
Panic helps no one – other than advertising and click dependent idiots. Don’t support them.